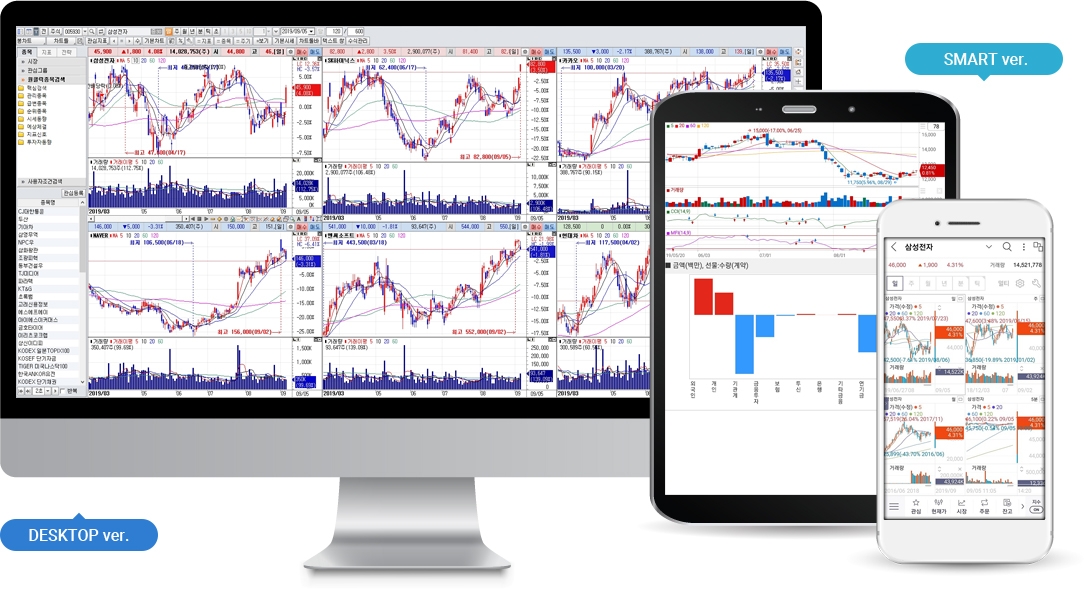
Multi-Chart (K-Chart 3.0®)
Chart solution that analyzes large amount of real-time financial data by visualization
Recognized as the world's best technology for real-time mass analysis chart (Exported to Indonesia, Thailand, Laos, Cambodia)
Proven chart solution (over 80% of market share)
Professional analytical chart solution with multi-chart configuration and various analysis methods
Majority of customers in Korea (No. 1 customer satisfied solution)
Features
-
01
World's Best Technology (Chart Analysis Function)
Specialized features including over 200 technical indicators and 60 chart analysis tools
02Analysis Chart for Global Financial Markets
Integrated analysis of domestic market, global market such as US and Japan, FX and overseas futures
-
03
Various Analysis Screens and Specialized Chart
Provide specialized analysis screen such as comparison chart, multi chart, simulation chart, and mini chart, etc
04Solution Proven in the Global Market
Planning to enter advanced markets (Japan, USA, Europe) based on the experience in the Asian market
-
05
Charts for All Market
Platformized to apply to all financial transactions such as stocks, futures, options and FX (domestic and overseas)
Main functions
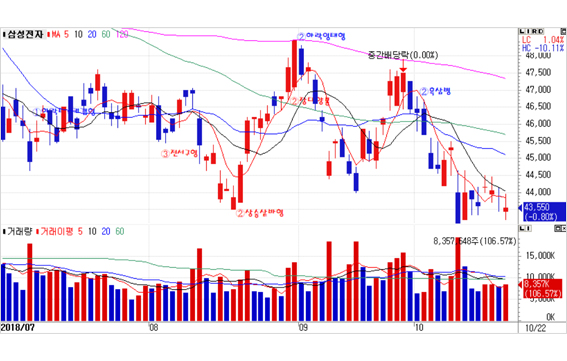
Real-Time Data Analysis using
Data Pattern Analysis, and Wave Theory
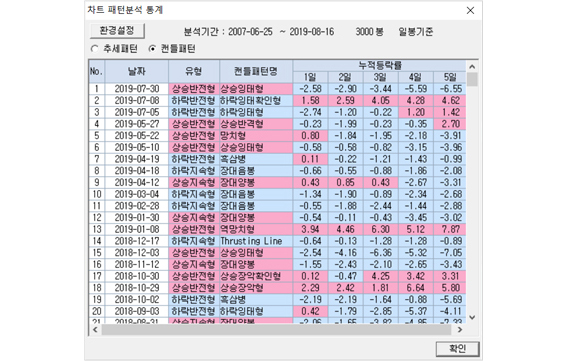
Understanding of Volatility and Data Analysis Statistics
through Pattern Analysis
- Automatic trend line through candle pattern analysis function, trend pattern of wave theory, and drawing method
- Draw on chart automatically by identifying key highs and lows
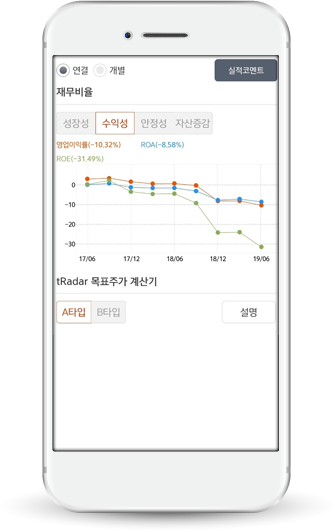
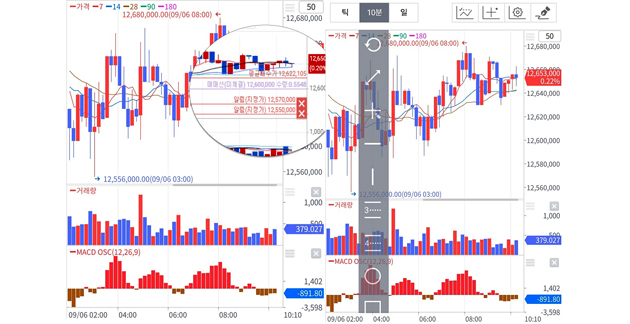
Mobile Chart (K-Smart Chart 3.0®)
UI / UX based chart solution optimized for mobile environment
- Mobile chart that provides specialized contents by applying various needs of customers in all smartphone environments
- World-class solution that combines multi-chart development experience and mobile expertise (most clients in Korea)

Features
-
01
Smartphone (Tablet) Optimized Analysis
Provide N cycle, various auxiliary indicators, baseline, various trend lines and analysis tools
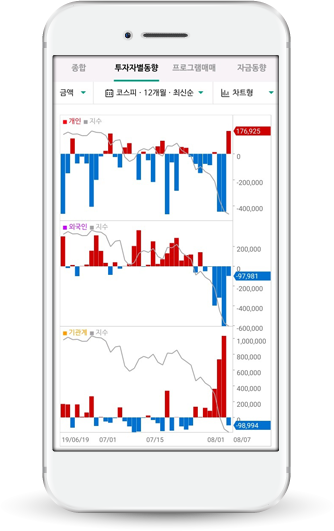
02Provide Various Chart Screens
Market, size, investor, gradient chart, multi split chart, comparison chart, etc.
-
03
Indicator Settings and Share Saved Charts
Chart type, key indicator settings, save and share set indicators
04Proven Mobile Chart Solution
Apply various mobile environments (user convenience), verify stability and determinism
Main functions

Split Charts and Synchronization

Real-Time Comparison Chart

Various Indicator Settings
- Provide split and sync function
- Provide stock charts for various markets
- Provide various analysis tools and indicators at a multi-chart level
(Ichi Moku Kinkou Hyo · Bollinger Band · Net Charts · Volume profile · Volume Moving Average · Price Moving Average · MACD · Disparity, etc.)
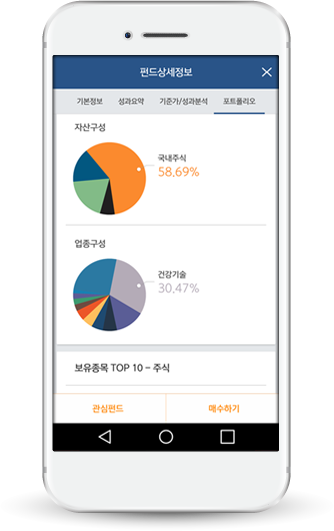
Pie Chart
Line Chart
Bar Chart
- Provide various types of chart screen
ex) Animation charts (Pie, Line, Bar, etc.)
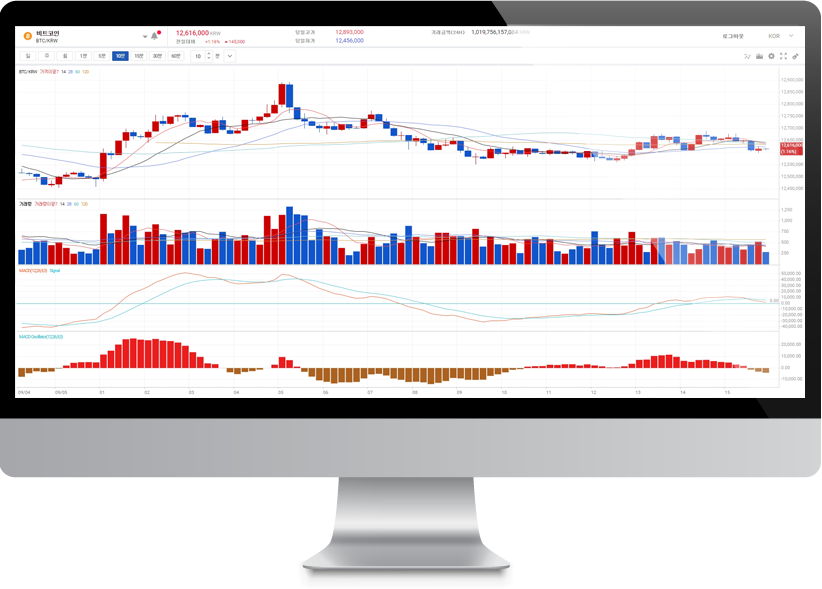
Web Chart (K-WEB Chart 2.0®)
Powerful web chart solution with multi-chart level processing and various investment analysis
More convenient and diversified investment analysis available in all web browsers
Features
-
01
HTML5 Trading Chart Available at Anytime, Anywhere
HTML5 based Web Chart, available in various browsers and media, web accessibility compliant
02Provide Multi-Chart Level Advanced Content
Multiple document interface (MDI) method to open multiple screens at the same time
-
03
Customized Charts
Customize charts according to the user's desired style by providing functions such as comprehensive screen and settings
04Various Analysis Services
Provides various web-optimized technical indicators and analysis tools, and show orders in real-time on a chart
Main functions
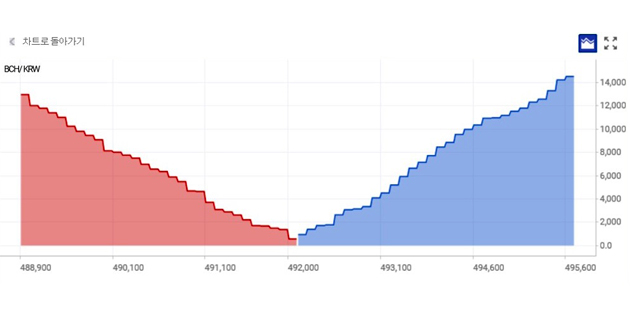
Depth Chart
Display Trade and Alert line
- Provide period and various trendline settings in the bar within the chart
- Depth chart showing cumulative amount by price
- Provide alert lines which users can get alerts when the set price is reached
- User-specific trade and alert lines are displayed on charts
Screener (Smart-Finder®)
Stock search solution based on investor's strategy
- Provides a variety of search methods based on advanced search engine to search stocks accurately
- Optimized search engine solution to respond flexibly to rapid financial changes
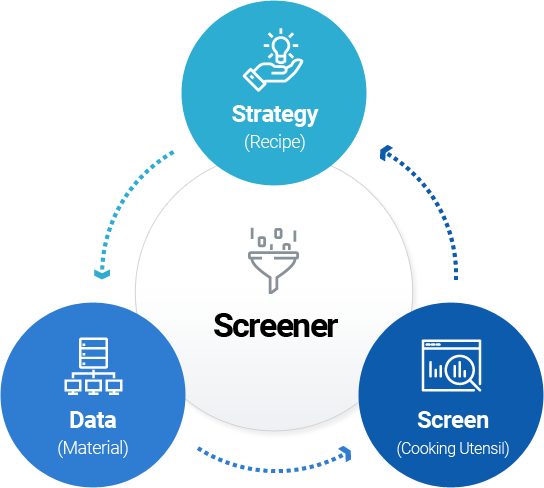
 Strategy(Recipe)
- User strategy (ideas, strategy)
- Expert recommended strategy
 Data(Material)
- Quote data (open / high / low / close price, trading volume, etc.)
- Master information (industry, management, theme, etc.)
- Financial Information, Investor Information
 Screen(Cooking Utensil)
- Expert screener
- One-click search
- Real-time monitoring
- Strategy verification / Simulation
Features
-
01
Customer Level Search
Convenient search available for stocks with a single click and provide specialized search functions such as quick search for beginners, sequential search, multi-time search, and condition value comparison, etc
02Real-time Monitoring
Provide real-time stock monitoring according to users' setting, amount monitoring search, system signal setting and alarm, etc
-
03
Custom Search
Provides stock search function based on user-created trend, candle, and section
04Performance Analysis
Provides performance analysis function through virtual return simulation of retrieved stocks
Main functions
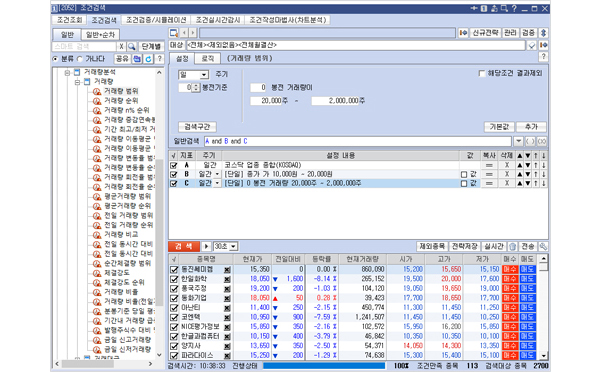
Screener
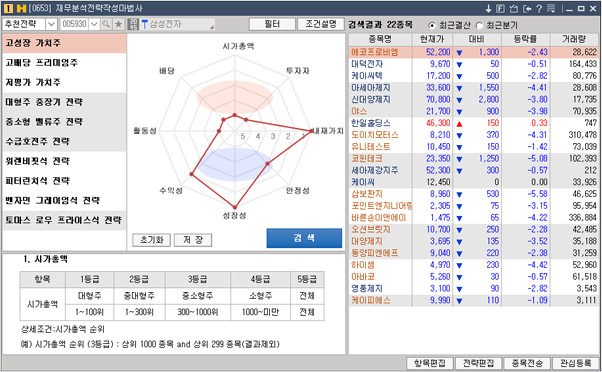
Financial Analysis Strategy
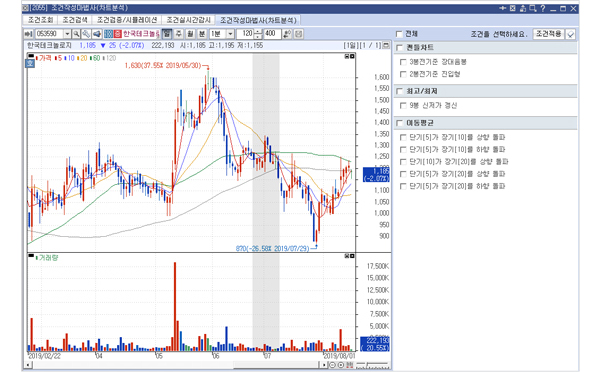
Chart Analysis Strategy
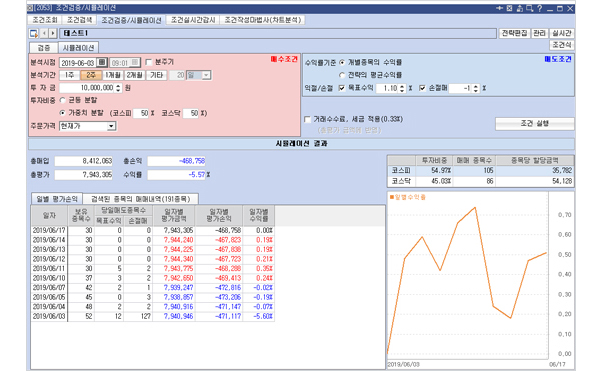
Simulation
- Easily search by selecting investment propensity by user
- After creating a strategy, search for stocks matching the strategy through real-time monitoring
- Pattern screener to search stock price trend and candle shape
- Analyze and verify yields by searching the past